Creating Landing Page Reports in Google Analytics 4 (GA4)
With the change to Google Analytics 4 (GA4) just around the corner in 2023, we wanted to make you feel a little less daunted by the change. This post will demonstrate how to run a GA4 landing report, and through some insightful tips will have you feeling confident in navigating GA4.
What Is Google Analytics 4?
GA4 is the latest web analytics tool out there. It is packed with great new features and a user-friendly interface.
Google continues to be one of the most common methods for website owners to keep tabs on their traffic, and Google Analytics 4 will be no exception.
With so many awesome features and a smooth user interface, it’s no wonder that over 28 million websites worldwide count on Google Analytics to track their traffic.
We work with startups to Enterprise businesses, and interestingly a recent survey by Enlyft found that roughly 71% of businesses that use Google Analytics are small companies with less than 50 employees.
How is the Landing Report Useful?
The landing report provides you with a map of the path that users travel when visiting your website.
It does this across multiple platforms that your content appears on, and as a result, is able to identify trends in consumer behaviour, and even predict future actions of consumers.
With the help of Artificial Intelligence, GA4 gives small businesses terrific insights into how their content is being consumed.
The difference here between GA4 and the previous model (Universal Analytics) is that instead of giving you a report of “sessions” that detail the blocks of time spent on your site by groups of consumers, GA4 analyses each user interaction independently.
This means that the landing report produced by GA4 gives you a more detailed look into your customer’s behaviour and assists you in creating an optimal SEO strategy.
Your landing page is vital as it is your consumer’s first interaction with your brand, so you want to make sure it is having the right impact.
How to Generate a Landing Report in GA4
Unlike Universal Analytics, GA4 requires you to manually generate the landing report, rather than select it from a menu of automated analytics.
Once you run it initially, you can create presets from your selections to make it a quick and efficient process in the future.
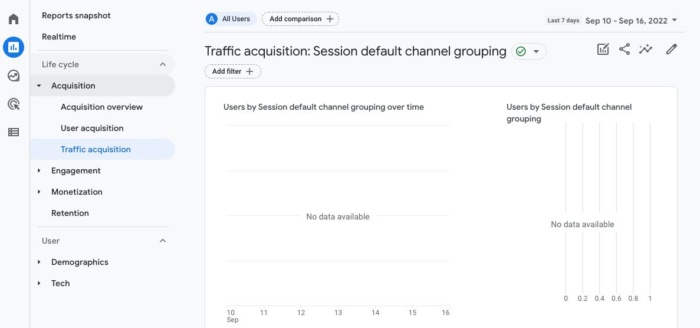
Once you are logged into your GA4 account, you head to the Reports icon and select Acquisition, followed by Traffic Acquisition.

These selections will generate a report for you using the default dimensions or categories, which in this case is the “Session default channel grouping” dimension.
Though this information is useful for generally increasing website traffic, it doesn’t provide insight into our consumer’s interaction with the landing page.
To do this, we need to customise which dimensions will give us the analysis we are after.
In your reporting screen, the small pencil icon in the top right-hand corner of the window will allow you to customise your report.
Here you can add new dimensions, new metrics, and generate summaries of the information.
To produce a landing report, we are concerned with just adding the correct dimensions to this report.
Within the list of dimensions, keep scrolling until you find one titled “landing page,” once selected, this will be added to your report.
To make this a saved preset, go back into the landing page dimension, click the 3 dots, and select the “Set as default” option.
This will become a handy time saver when you are frequently running this report.

Deeper Dive into the Landing Report
Now that you have customised the dimensions, you can begin to drill down on the metrics.
It’s a good idea to explore the metrics available and determine which ones provide you with the most insight into your site’s performance, and your consumer’s behaviour.
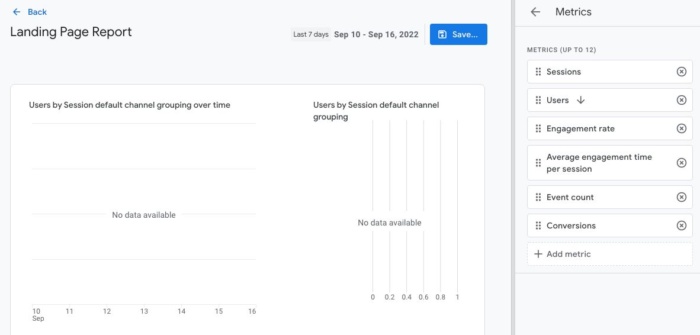
Like the previous steps, this time you are selecting “Metrics” instead of “Dimensions” to customise your report.
You can add or remove metrics at will; however, a good starting point would be to look at the following core metrics:
- New Users
- Engagement Rate
- Average Engagement Time
- Conversions
- Sessions
- Event Count
Once you have selected these, along with any other metrics you see that you think will be useful, you can create a summary card from your report.
This is a great way to have an overview of the analytics, that allows you to spot consumer behaviour trends with ease.
By clicking “Create a new card” you have the option to choose specific dimensions, metrics, and layout styles for your summary card.

How to Save Your Report for Next Time
Remember to save your work as a “New report” when trying new combinations, so as not to override existing templates you have created.
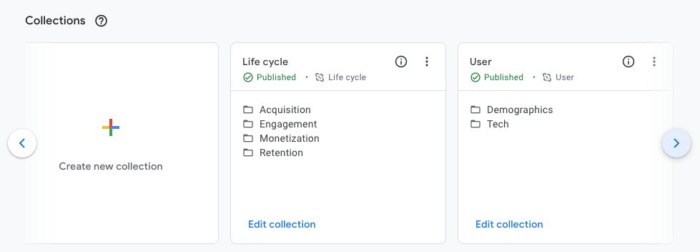
For the most used reports, you can create a shortcut within GA4 by clicking on “Reports” and then clicking on “Library” Here you should be presented with 2 collections (provided you haven’t already saved reports here previously).
Once the collection is titled “Life cycle” and this is the one you need to edit by clicking “Edit collection.”
A pop-up will request you to drag and drop the reports that you would like added to this collection.
There will be existing folders with different topics, and you want to drag your landing report into the folder titled “Acquisition.”
Now each time you are on the reports page, you will be able to select the “Life cycle” folder and find your landing report in the “Acquisition” folder ready to go.

After It’s Created and Saved, How do I Use the Landing Report?
The basis for running these reports is to understand what pages of the site are attracting customers, and how the overall content can be improved to continue to drive new traffic to the website.
From the landing report, you will be able to determine which pages on your website are underperforming.
This may look like a low number of hits on the page or a low level of engagement (not clicking on buttons or links on the page).
These can be used as opportunities to improve your website by focusing on working on these pages.
Conversely, when a page has a high number of hits and a great engagement rate, you want to use the model of that page to assist in boosting the lower-performing pages by emulating content or copy styles.
You can also try to link back to the performing pages as much as possible to continue to build on that high-quality content.
These popular pages might be where you include information about upcoming events, products, or promotions to make sure they get the most exposure possible.
By having an understanding of GA4, and how this landing page can be generated, you will be ahead of the curve in the competitive world of Google Analytics.
The sooner you create your GA4 account and get your website tracking up and running, the bigger the sample size of data you will have to work with once UA is no longer active.


